Fun With Sine Waves #2
Fun with matplotlib!
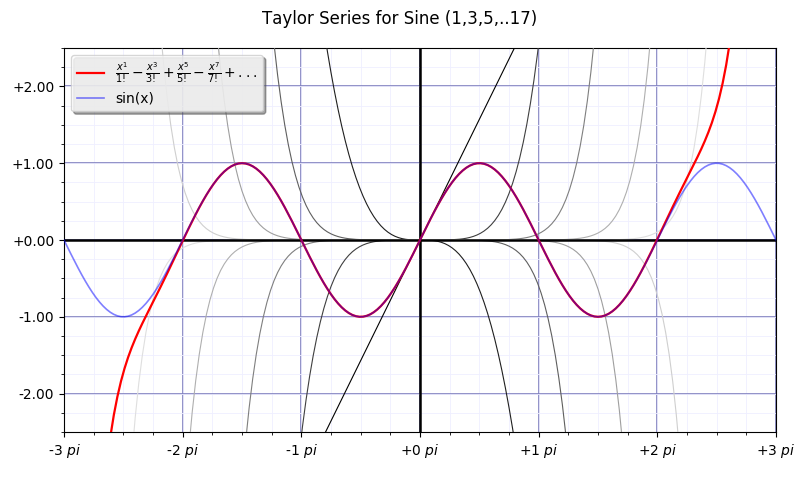
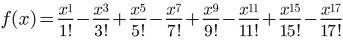
Displays the Taylor series, eight terms worth, for sine.
In other words:
Each individual term of the series is shown in fading (not 50) shades of gray. The first term, effectively f(x)=x, is the darkest line, the straight diagonal one. Each term after is shown in a progressively lighter shade of gray.
The sum of the series is shown in red. Shown in blue is f(x)=sin(x). In the -1 pi to +1 pi domain, the fit of the series sum to the sin(x) curve is nearly exact!
And since the sin(x) function repeats outside that domain, the Taylor series provides a very accurate sine curve!