SR #9: Light Diagrams
 Flyin' by at ½ c…
This week I've introduced you to time-space diagrams. They're the foundation of everything that follows in this series, so I hope you're feeling very comfortable with them.
I also introduced you to space-time events, and I apologize for any confusion in calling the diagrams "time-space" and the events "space-time." Six of one, half-dozen of the other. I wanted to stress the time component of the diagrams, whereas space-time is the more usual general term.
Today we wrap up the week with some important diagram details.
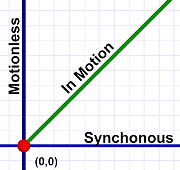 Slanted lines show motion!
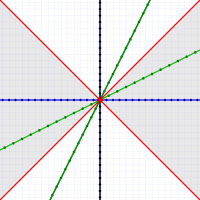
On our diagrams, a slanted line indicates movement through both time and space. A strictly vertical line indicates standing still while "moving" through time. A strictly horizontal line indicates instantaneous motion through space.
Of course, there's no such thing as instantaneous movement through space (I'll get more into what horizontal lines really mean below). All motion requires some amount of time (although we're going to encounter something very bizarre regarding light).
Therefore, all motion through space-time involves lines that slant!
Note that the angle of slant (the slope) of a motion line indicates the speed of the motion (remember that speed involves distance and time). If a strictly vertical line is no spacial motion at all, an almost vertical line represents something moving slowly. Conversely, a nearly horizontal line indicates high speed (a strictly horizontal line would imply infinite speed).
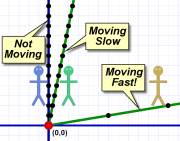 Al standing still, Em and Max moving at different speeds.
In the diagram to the right, we see Al standing still, Em moving slowly (and smoothly) away from him, and Max moving away much faster (also smoothly). The black dots represent timer ticks. You can see how far Max moves in just two ticks!
It might seem a bit backwards, but the steeper the slope of the line, the slower the speed. (Remember a vertical line means no speed at all.)
A crucial point here is that the vertical and horizontal scale of our diagram has a great deal to with the angle of the motion lines. The same speed can be represented by different slope angles depending on how we pick our horizontal and vertical units.
If we pick large time units (say hours) and small space units (say inches), the motion lines flatten out because even slow speeds can cover lots of inches in an hour.
 Motion lines at a given speed have a different slope angle depending on the time and space scales we select.
If we pick small time units (say seconds) and large space units (say miles), the motion lines become steep because even at high speeds it takes lots of seconds to go a mile.
When it comes to graphs like this, the scale really matters!
All our diagrams involving light will be normalized such that light always travels at a 45-degree angle. The motion of any light beam we depict is always upwards (of course) and left or right at a 45-degree angle.
This has some interesting consequences for the scale of our diagrams.
If we think of the vertical units (timer ticks) as seconds, this forces us to use horizontal units of one light-second — the distance light travels in one second. Which is three-quarters of the way to the moon (186,000 miles aka 300,000 kilometers)!
On the other hand, if we want smaller spacial (horizontal) units, our time units have to also be smaller. If we measure distance in feet, our timer ticks are nanoseconds (billionth seconds). If we measure in meters, our timer ticks can be three nanoseconds (which is still really tiny).
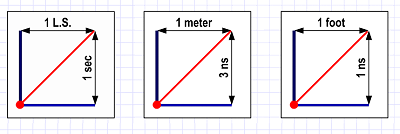 We want motion lines representing light speed to have a 45-degree angle, and this constrains our choices of time and space units.
None of this actually matters — the physics works the same way at any of the scales we have in mind. It's just something to keep in mind as we consider the diagrams.
You may wonder: If light speed — the fastest thing in the universe — is shown as a 45-degree slant, what do the speeds we're more familiar with (trains, baseballs, even rockets) look like?
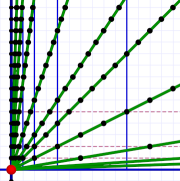
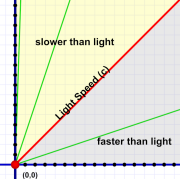 Moving faster than light (the gray area) is impossible as far as we know. Note the nearly vertical (slow-moving) motion line along the left edge.
They all look very nearly — but not quite — like vertical lines. You'd have to zoom way in to see the difference.
The diagram to the right shows three motion lines (in green). These, from left to right, show speeds of 1/30th, 1/3rd, and 3-times, light speed (c).
Keep in mind that even 1/30th the speed of light is still over 20 million MPH! The speeds we're more used to look like vertical lines at this scale!
Next week, when we show Em zipping past, she'll be moving a very high speed — typically at half the speed of light!
(The effects of Special Relativity only become significant at high speed.)
You may also wonder about motion lines less steep than light. Such lines indicate speeds faster than light — something we're pretty sure is impossible.
The main point I want to make here is that, if our diagrams had the kind of vertical-scale timer ticks we're used to (like seconds), the horizontal scale has to be very large — specifically, the distance light travels in whatever time unit we pick. That's the only way we can show light traveling at a 45-degree angle.
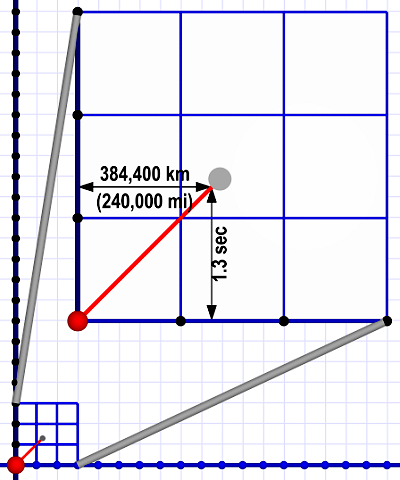 A vertical time scale of seconds requires a horizontal distance scale of light-seconds (186,000 miles or 300,000 km). This diagram shows what shining a laser at the Moon (gray dot) looks like at such scales.
The bottom line is that our timer ticks will actually be very short. Exactly what those units are doesn't matter. I'll refer to timer ticks as a generic term for time units. That means our distance units are light-ticks — the distance light travels in one of those ticks.
I want to return briefly to what the horizontal lines in our diagrams really mean. (We'll be exploring this in detail next week.)
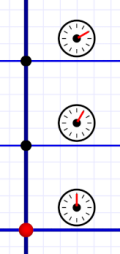 Snapshots taken every timer tick.
I said above that, if we think of them as motion, they imply instantaneous movement in space with infinite speed (which is impossible). So we can't think of them as motion (until we talk about FTL and "ansibles").
In previous posts I called horizontal lines "snapshots," and that is a good way to think of them. A snapshot is a frozen instant in time that captures everything the camera lens sees happening at that moment. (There's an interesting caveat I'll discuss another time.)
A horizontal line on our diagrams is an instant of time. Every event on the line is happening at that instant. Distance along the line indicates spacial distance between simultaneous events.
And that is where I'll pick up on Monday. Hang on to your hats, because we're about to step into the Special Relativity rabbit hole!
This Week…
I introduced you to time-space diagrams and space-time events. The important points are:
- Time-space diagrams are two-dimensional graphs where the vertical axis shows time and the horizontal axis shows one dimension of space (distance).
- Time always moves upwards. It begins at the bottom and ends at the top.
- Motion lines are slanted. The angle depends on the vertical and horizontal units picked. (Motion is always forwards in time, so motion lines always "point" upwards.)
- We pick those units so that light always moves at a 45-degree angle on these diagrams. A steeper (more vertical) angle is a speed slower than light. A shallower angle (more horizontal) is a speed faster than light.
- A space-time event is any location in space at a specified time. Therefore, a space-time event has spacial coordinates and a time coordinate.
Enjoy the weekend! See you next week.