Finding the root for f(x)=x2+4
 |
 |
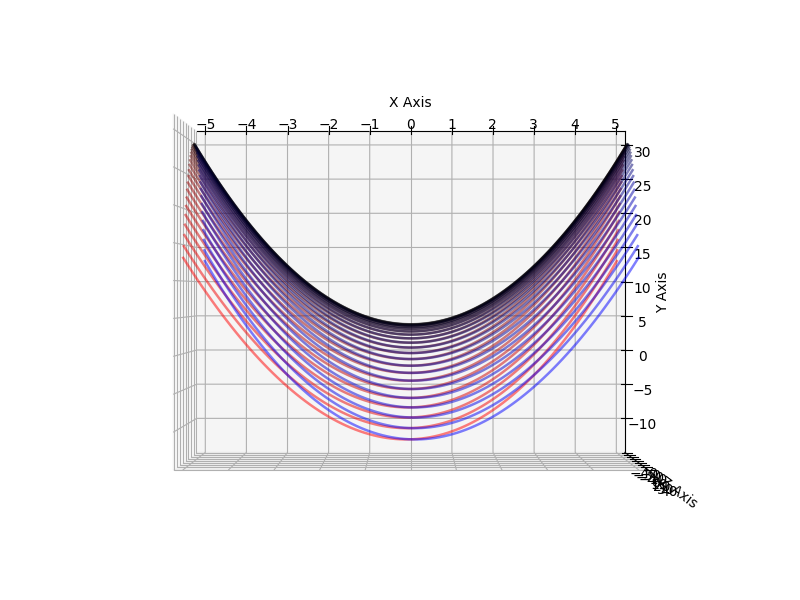 |
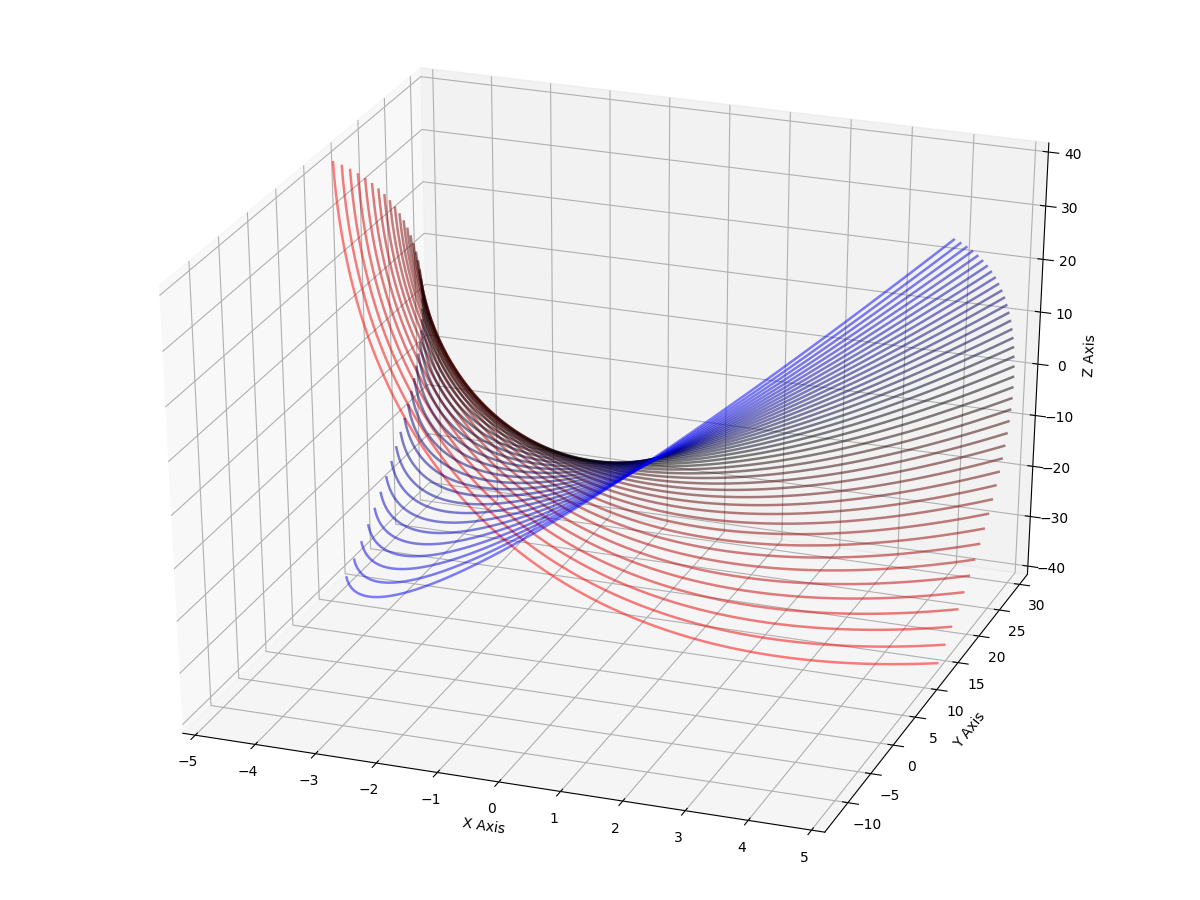
| along the X-axis | along the Y-axis | along the Z-axis |
|---|
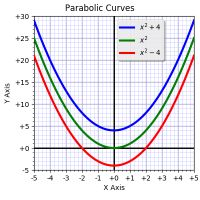
There is a basic rule of mathematics that says a polynomial expression always has a root. (That is: there is always some value of x where f(x)=0.)
For example, for f(x) = x2, the root is zero. When x=0, then x2 also equals zero.
As an only slightly harder example, f(x) = x2−4 has two roots. When x=2, then x2=4, and 4−4 is zero. The other root is when x=-2, because -22 is also equal to four.
But when we have f(x) = x2+4 there seems no possible root, because we need some x where x2=-4. Yet no (normal) number squared can ever be negative.
But the rule claims there must be some x that satisfies f(x)=0, so there must be some solution…
Enter “imaginary” (complex) numbers.
If we simply assume there exists a special number, call it i, that when squared gives us -1, we're home free. (We can never actually use i directly; we always have to square it in the end.)
Then our polynomial, f(x) = x2+4, has the root 2i, because (2i)2 gives us 22 × i2, which is 4 × -1 = -4 (exactly what we need).
There is a second root: -2i, because -22 × i2 is also equal to 4 × -1 (in the same way that a real number squared is always positive, a real number times i squared is always negative).
Thus, complex numbers allow us to solve problems we can't with just the real numbers. (Let alone the rationals or naturals.)
All complex numbers have the form: a + bi. The real numbers are actually a narrow (knife-edged, in fact) subset of the complex numbers where i is zero (a + 0i).
But what does it look like?
My question was how that looked. It's very easy to visualize equations like f(x) = x2, because they are only two-dimensional. An ordered set of real points along x results in a set of real points in y. One. Two.
Using complex numbers adds a couple of wrinkles:
Firstly, the math of the equation needs doing with complex numbers, which means dusting off your high school algebra. Something like x2 becomes (a+bi)2, which expands to a2 + 2abi + i2 (where both a and b are real numbers and i is the magic).
The good news is that Python has a complex data type, so you don't have to do the math yourself.
Secondly, there is the matter of visualizing complex numbers. The normal plot uses up the two dimensions available on paper or display showing the x and y axes. Visualizing a single complex number also takes two axes: the real part (usually x) and the “imaginary” part (usually y).
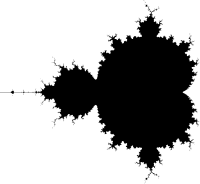
The famous Mandlebrot is exactly such a visualization. It's the complex plane as just described with the x axis (the real part) running from roughly -2 to +2. The vertical y axis is the “imaginary” part (with roughly the same range ±i).
Each point on the plane is a complex number where a + bi maps as x + yi (here the i stands in as a reminder, but is effectively ignored; plotting is done with just x and y).
The simple (“pure”) coloring of the plane paints each point (complex number!) either black or white, depending on whether that point is inside (black) the Mandelbrot set or outside (white). Such a coloring is show here, to the left.
The point (pun!) is that the input numbers “use up” both x and y axes. There is no axis left for showing any output number.
In Mandelbrot visualization, color represents the output of whatever function is applied to the input point. That allows a single dimension, either a black-and-white in-or-out display, or something more colorful (a common coloring is based on how fast the point shows itself to be outside the set).
And the real point is that trying to show a set of complex output numbers (which needs two dimensions) and the set of complex input numbers (also two dimensions) obviously required four dimensions.
Even a 3D projection onto a 2D display surface is gonna be a problem. There's no simple way to accomplish it.
Plotting Complex Numbers
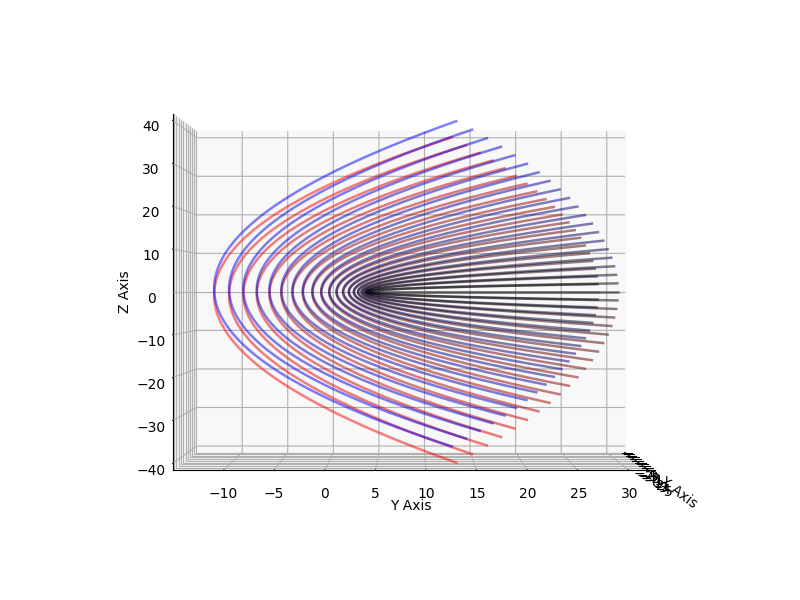
What we can do is show a given output set in full glory, plus one of the input dimensions, and we can fake the other input dimension using multiple output curves.
For example, we can plot f(x) = x2+4 showing the usual x and y for both real parts. We can use the z axis for the output “imaginary” part. For the input “imaginary” part, we draw multiple plots for different values of i.
Which is exactly what I did here.
…
I'd forgotten what a PITA writing HTML pages from scratch is. (At least it is when you have high standards and want them just so.) I've spent all afternoon writing this page, and I'm bored and want to move on. So… work in progress. I shall return anon. Or not. You get the gist.